Purpose: Identify the power maximum and efficiency of solar cells
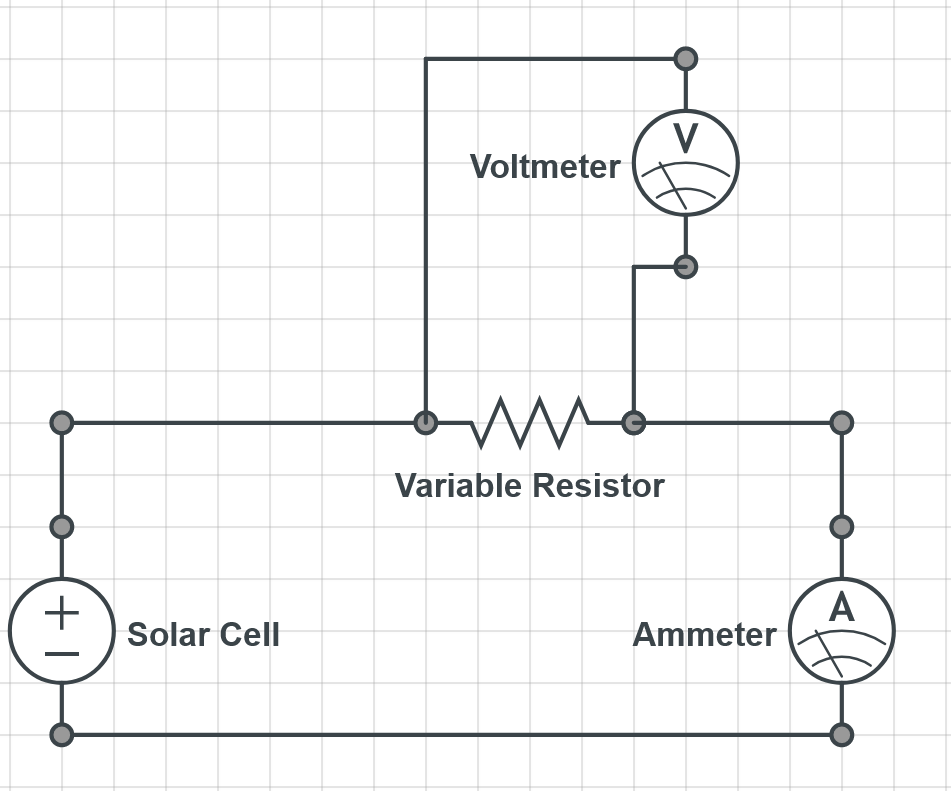
Method: Measuring voltage and current of a polycrystalline and polymer solar cell while varying resistance with potentiometer
Outcome: Efficiencies of cells calculated within expected ranges
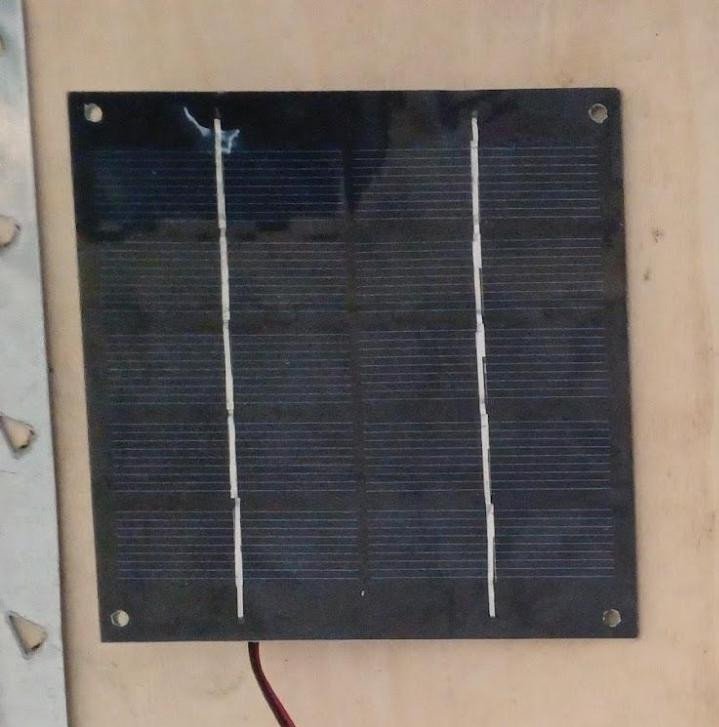
Polycrystalline: η = 12.51%
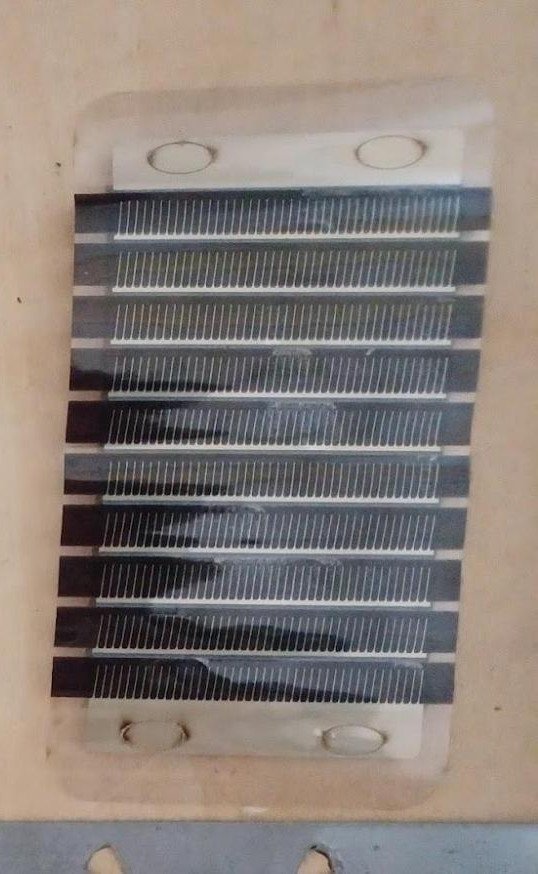
Polymer: η = 2.19%
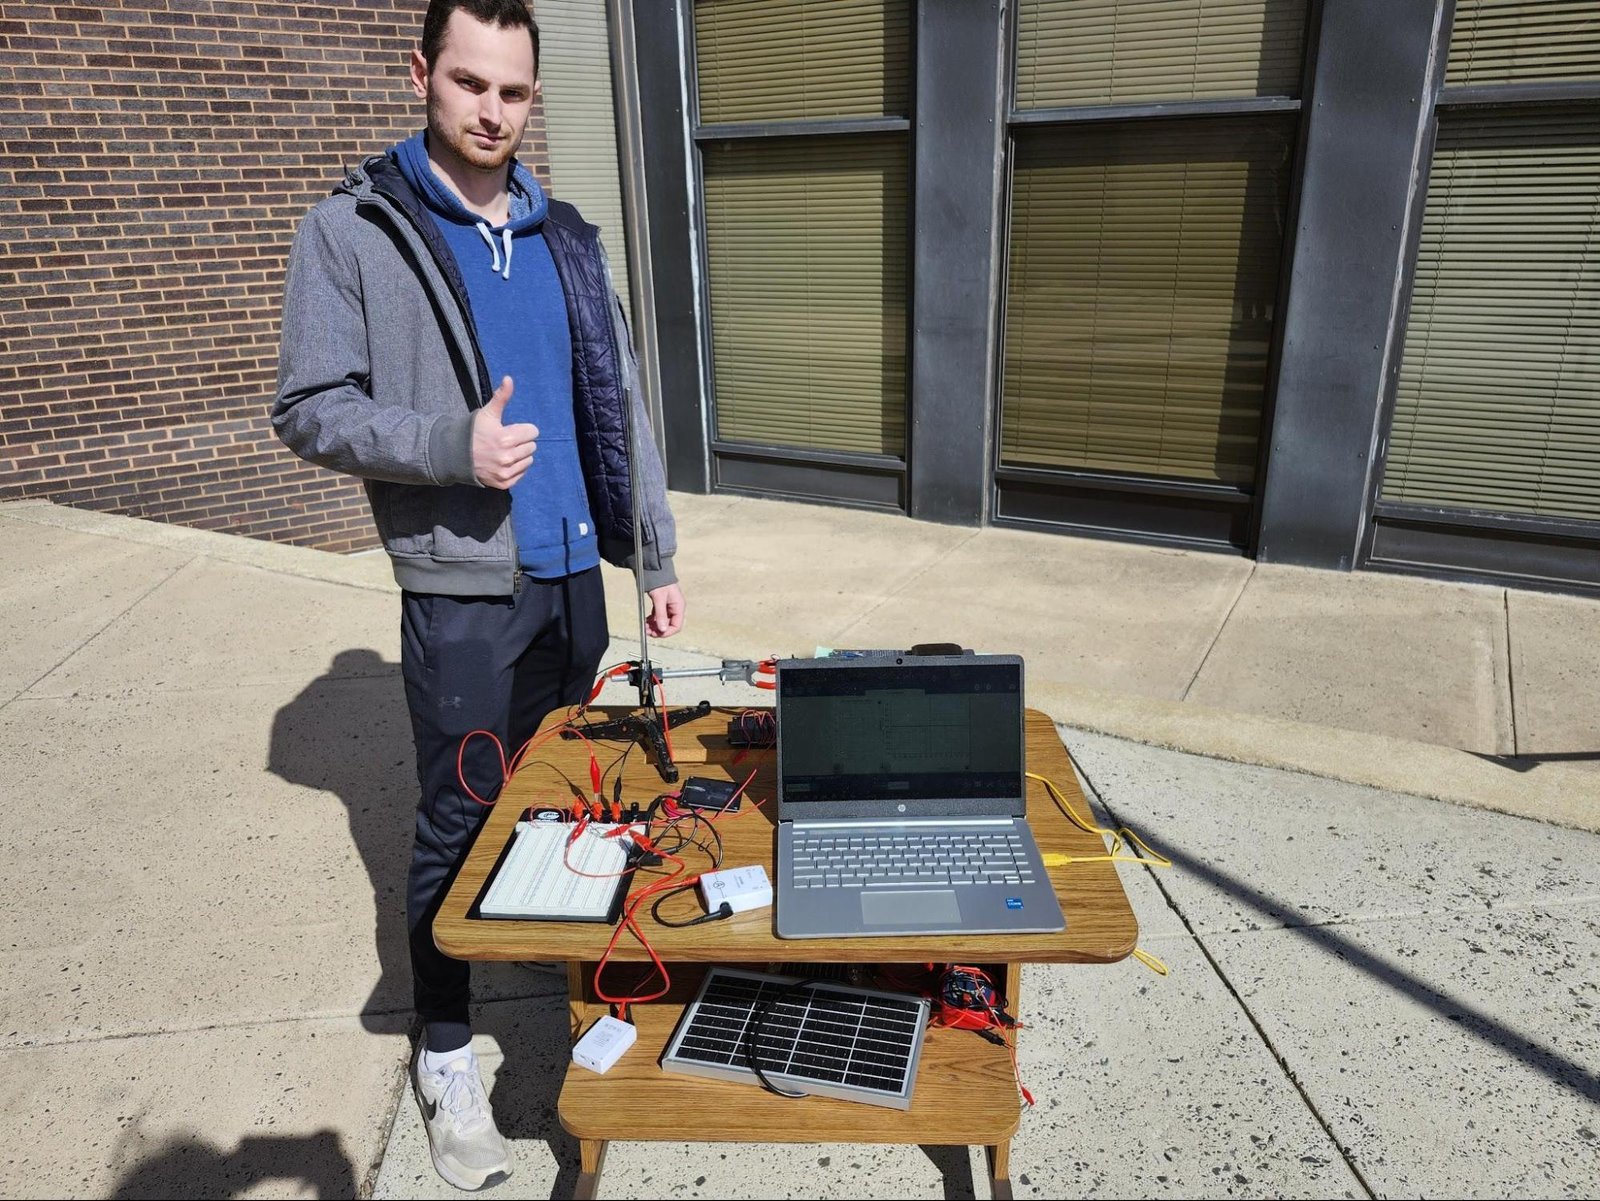
Collaborator Justin Smith with our outdoor setup
Solar Cell Types: Polycrystalline, Polymer
Potentiometers: 1k, 2k, 5k
Arduino motor used to rotate potentiometer and vary resistance
PASCO Bluetooth Voltmeter and Ammeter
Recording software: SparkVue
Background
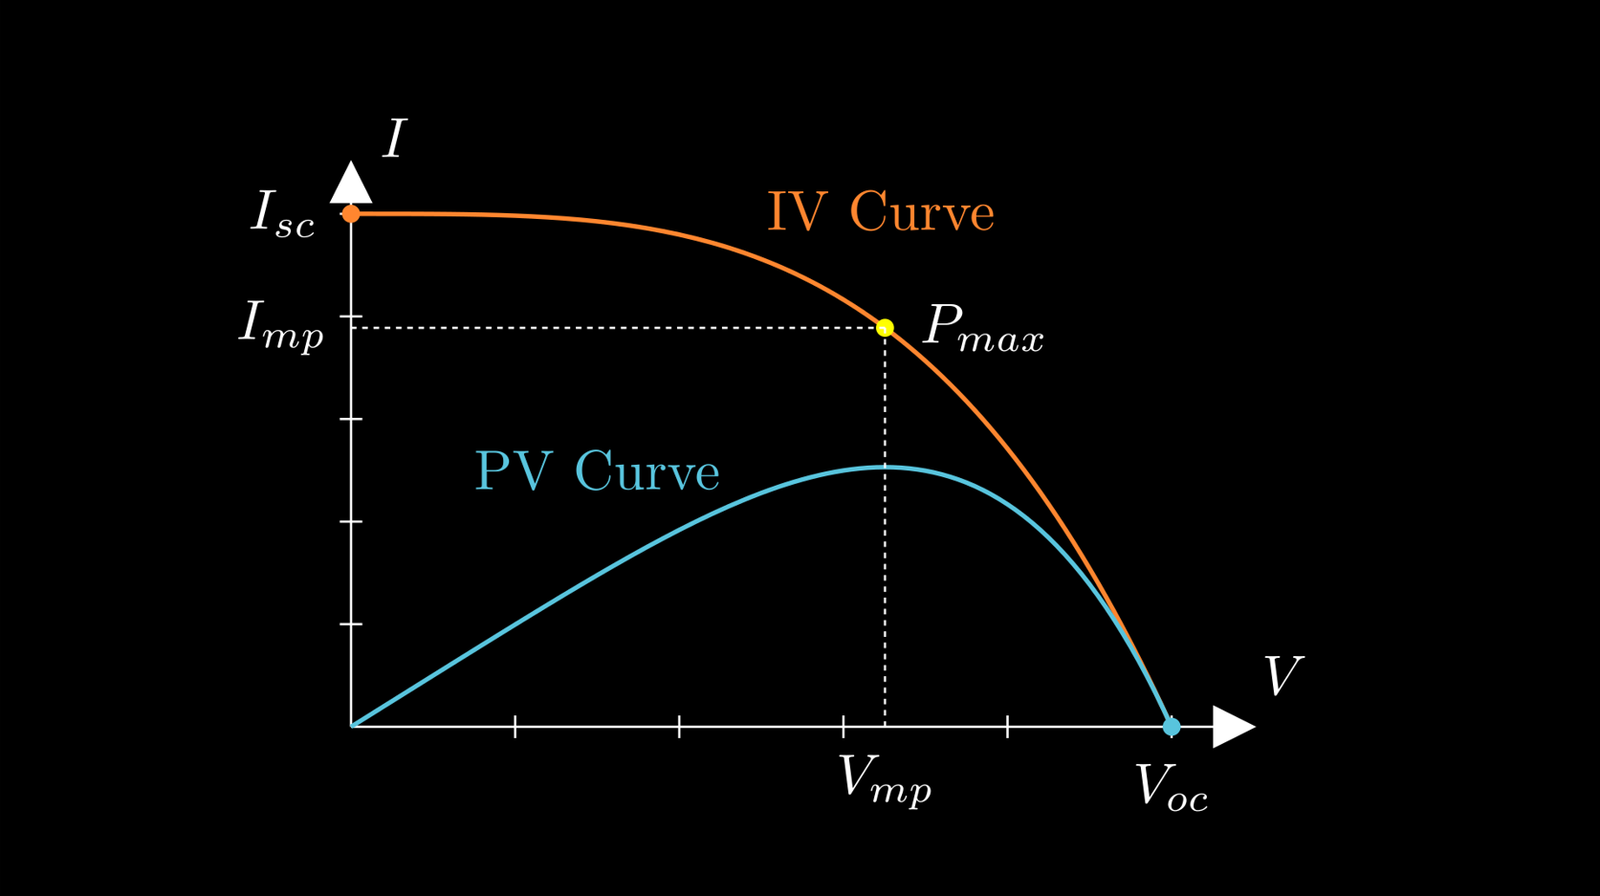
Solar cells have a “characteristic” IV curve which ranges from their short-circuit current (where V = 0) to their open-circuit voltage (I = 0).
Between these two points is a power maximum. This is given by the point (Vmp, Imp).
The power output of the panel is a function of the resistance of the load. As the resistance changes from 0 to Rmax, we move along the curve from Isc to Voc.
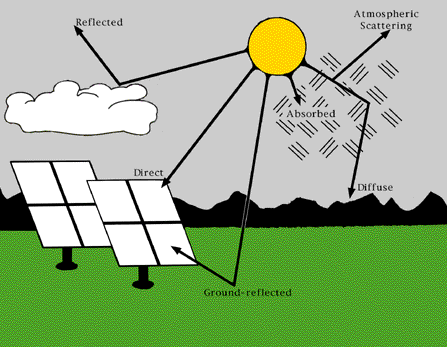
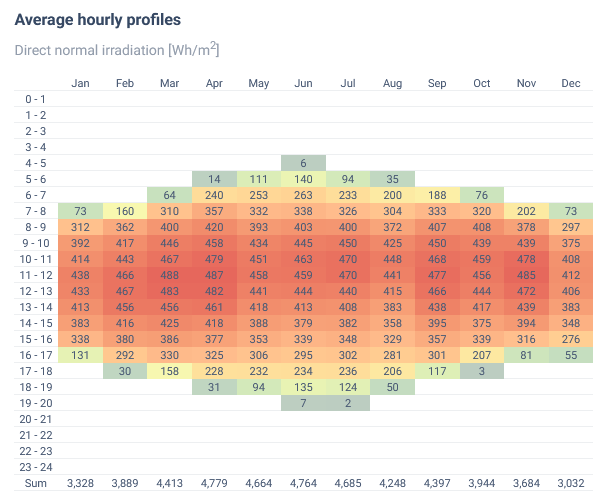
Direct Normal Irradiance

Irradiance: Time average of the power delivered per unit area
Units: W/m2
For this project, solar panels were ensured to be oriented directly to the sun for the purpose of using existing DNI data to calculate power in.
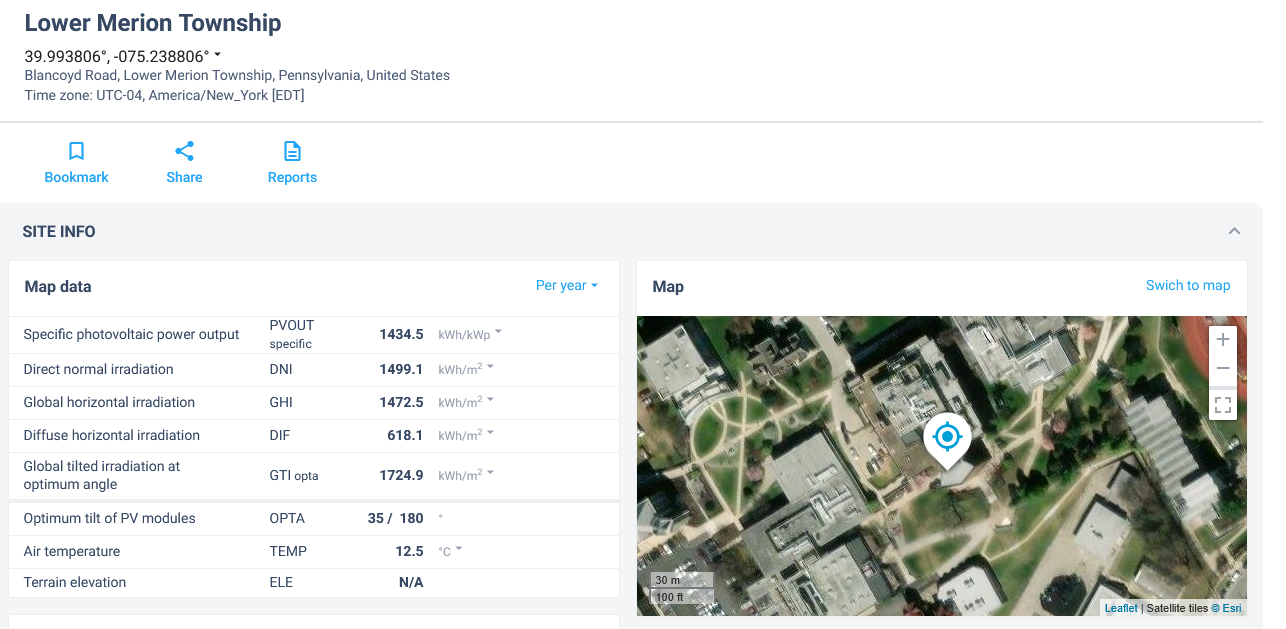
Direct Normal IRRADIATION data was collected from https://globalsolaratlas.info.
We specified the latitude and longitude of our setup and used the chart to determine the correct amount of power in for the time of day.